Water Quality & Drinking Water Safety: Complete Home Guide
Why Water Quality Matters for Human Health
Water is the foundation of life. Every human requires clean, safe water to maintain hydration, facilitate metabolic processes, and support cellular function. Yet, the quality of drinking water varies widely, even within developed countries, and exposure to contaminants can have both acute and chronic health impacts. Understanding why water quality matters is critical not only for personal health but also for informed decision-making about testing and treatment solutions.
Global Dependence on Treated Water
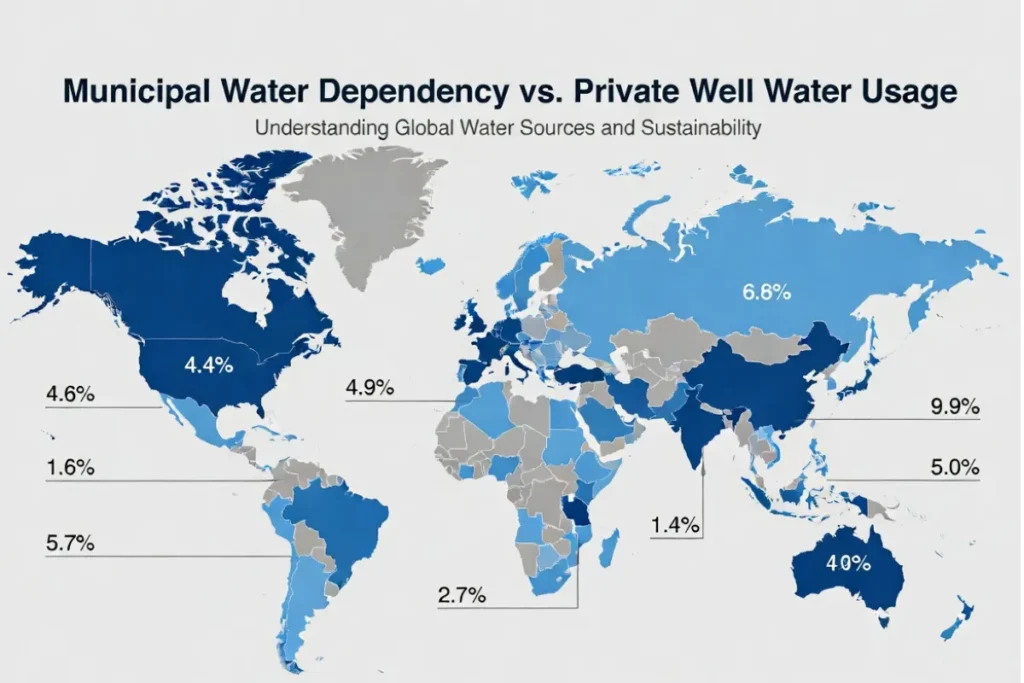
According to the World Health Organization (WHO), over 2 billion people globally rely on drinking water that may contain microbiological or chemical contaminants. In developed regions, such as the United States, municipal water systems are subject to strict regulation, yet even treated water can contain residual chemicals like chlorine, disinfection byproducts, or trace metals from aging pipes.
Key points:
- Municipal water reliance: Most households depend entirely on city water, assuming it is safe.
- Private wells: Approximately 15% of U.S. households use private wells, which are unregulated and can carry contaminants from surrounding soil, septic systems, or agricultural runoff.
- Cumulative exposure: Daily ingestion of water means even low-level contaminants can accumulate over time, increasing chronic risk.
Acute vs. Chronic Exposure
Water contaminants affect health in two main ways:
- Acute exposure – short-term ingestion of highly contaminated water can lead to gastrointestinal illness, nausea, or vomiting. Examples include E. coli outbreaks in municipal systems or contamination after heavy rainfall affecting wells.
- Chronic exposure – long-term consumption of water containing lead, PFAS, arsenic, or microplastics may increase risks of cardiovascular disease, neurodevelopmental effects in children, kidney disease, or endocrine disruption.
Table Idea: Acute vs Chronic Exposure Examples
| Type | Contaminants | Potential Health Effects | Common Sources |
|---|---|---|---|
| Acute | E. coli, coliform bacteria | Gastrointestinal illness, diarrhea | Contaminated well water, treatment failures |
| Chronic | Lead, arsenic, PFAS | Neurological effects, cancer risk, kidney/liver issues | Old pipes, industrial runoff, contaminated groundwater |
Water as Daily Cumulative Exposure
Humans consume water not only by drinking but also through cooking, beverages, and hydration of foods. Additionally, water interacts with the body through bathing, which, while not ingesting, can contribute to dermal exposure for certain chemicals like chlorine or volatile organic compounds (VOCs).
Key Takeaways:
- Average adult drinks 2–3 liters per day; children proportionally more per body weight.
- Cooking and beverage preparation amplify exposure: boiling does not remove all chemical contaminants, though it may kill microbes.
- Daily cumulative exposure to trace contaminants—especially heavy metals and PFAS—requires awareness and mitigation.
Vulnerable Populations
Some individuals are disproportionately affected by water contaminants due to age, physiology, or pre-existing conditions:
- Infants & children: Developing organs are highly sensitive to lead, arsenic, and PFAS exposure.
- Pregnant individuals: Some chemicals can cross the placenta, affecting fetal development.
- Elderly & immunocompromised: Weakened immunity increases susceptibility to microbial contamination.
- Chronic illness patients: Kidney disease, liver disease, or endocrine disorders can be exacerbated by contaminants.
This emphasizes the importance of personalized water safety strategies, whether through filtration, testing, or source management.
Regulatory Trust vs Personal Responsibility
Even with robust regulation, such as EPA Safe Drinking Water Act compliance, water quality incidents still occur. Examples include:
- Flint, Michigan lead contamination crisis
- PFAS contamination in industrial-adjacent water supplies
This underscores a dual approach: trust in regulations and active personal responsibility, including testing, filtration, and informed system maintenance.
✅ Section Summary
- Clean drinking water is essential for human health.
- Both acute and chronic exposures carry risks.
- Vulnerable populations require heightened attention.
- Regulations provide a baseline, but individual action is essential.
This section sets the foundation for understanding contaminants, testing, and filtration technology in the upcoming sections.
Read the Air Quality Guide
How Drinking Water Is Regulated
Safe drinking water depends on a combination of regulatory oversight, engineering standards, and ongoing monitoring. Understanding these frameworks helps homeowners contextualize risks, interpret testing results, and make informed filtration decisions.
United States Standards
The U.S. Environmental Protection Agency (EPA) regulates public water systems under the Safe Drinking Water Act (SDWA). Key elements include:
Maximum Contaminant Levels (MCLs)
- Legally enforceable limits for over 90 contaminants, including:
- Microorganisms (E. coli, coliform)
- Inorganic chemicals (lead, arsenic)
- Organic chemicals (VOCs, disinfection byproducts)
- Homeowners receive Consumer Confidence Reports (CCRs) annually with system-specific compliance data.
Action Levels vs Enforceable Limits
- Action Level: Threshold triggering remedial action, e.g., lead action level = 15 ppb
- MCL: Maximum level legally allowed in treated water
- Action levels are preventive; exceeding an MCL triggers system-wide corrective measures.
Water System Oversight
- Public water systems: Regular sampling, public reporting
- Private wells: Unregulated; testing responsibility falls on homeowners
Global Guidelines
Beyond the U.S., international guidelines are issued by the World Health Organization (WHO):
- WHO sets Health-Based Targets for contaminants (chemical and microbial)
- Focuses on risk-based approach: exposure + toxicity
- Provides technical guidance for emerging contaminants like PFAS, microplastics, and pharmaceuticals
Comparison Table: EPA vs WHO
| Parameter | EPA (US) | WHO (Global) | Notes |
|---|---|---|---|
| Lead | Action Level 15 ppb | Guideline Value 10 ppb | Slightly stricter WHO guidance |
| Arsenic | MCL 10 ppb | Guideline 10 ppb | Consistent |
| PFAS | No enforceable MCL yet | Provisional limits 0.1–0.5 ppb | Emerging contaminant guidance |
Where Regulation Has Gaps
Even with robust oversight, water regulation has limitations:
Emerging Contaminants
- PFAS, microplastics, and pharmaceuticals are not fully regulated
- Regulatory lag means residents may be exposed to contaminants without enforcement
Infrastructure Aging
- Lead pipes, corroded fittings, and old treatment plants can introduce contaminants after regulation compliance
- Example: Flint, Michigan – water was technically “treated” but contaminated during distribution
Risk-Based Limitations
- MCLs are often based on average adult consumption, which may not account for infants, children, or pregnant individuals
- Certain chemicals have no safe exposure level, e.g., some PFAS and endocrine disruptors
Implications for Homeowners
Key takeaways:
- Regulatory compliance does not guarantee zero-risk water
- Home testing is essential for private wells or older urban infrastructure
- Awareness of MCLs and action levels enables better filtration choices
- Regulations provide baseline trust; mitigation strategies are personal responsibility
✅ Summary
- U.S. water systems operate under SDWA with enforceable MCLs and action levels.
- WHO guidelines provide global health-based targets.
- Regulation gaps exist for emerging contaminants, aging infrastructure, and vulnerable populations.
- Homeowners must supplement regulatory compliance with testing and filtration to ensure safe drinking water.
Common Contaminants in Drinking Water
Drinking water can contain a broad spectrum of contaminants. Understanding their sources, health risks, regulatory limits, and removal methods is critical for homeowners and professionals alike. This section provides a detailed, evidence-based review of microbial, chemical, disinfection byproducts, and emerging contaminants.
Microbial Contaminants
Bacteria
Key Species:
- Escherichia coli (E. coli)
- Total coliforms
- Salmonella, Campylobacter (less common in treated water)
Health Impacts:
- Gastrointestinal illness, diarrhea, nausea, vomiting
- Severe infections in immunocompromised individuals and young children
Sources:
- Surface water contamination
- Septic system leakage
- Treatment failures or distribution system breaches
Detection & Mitigation:
- Home kits detect total coliforms and E. coli
- Boiling water kills bacteria
- Filtration using certified point-of-use (POU) filters
Viruses and Parasites
Examples:
- Norovirus, Hepatitis A virus
- Giardia, Cryptosporidium
Health Impacts:
- Gastrointestinal infections, sometimes severe or prolonged in children and elderly
Sources:
- Contaminated surface water
- Ineffective treatment
Mitigation:
- UV disinfection and reverse osmosis are effective
- Boiling for viral and protozoan inactivation
Chemical Contaminants
Chemical contamination is a leading concern due to long-term chronic exposure.
Heavy Metals
- Lead: Neurodevelopmental effects, cardiovascular risk; commonly from old pipes
- Arsenic: Carcinogenic, kidney/liver toxicity; naturally occurring in groundwater
- Copper: Gastrointestinal upset at high concentrations; corrosion of plumbing
Detection & Mitigation:
- Lab testing for precise quantification
- Reverse osmosis, distillation, and NSF-certified carbon filters
Nitrates
- Common in agricultural regions due to fertilizer runoff
- Health Risk: Blue baby syndrome in infants, potential cardiovascular effects in adults
- Mitigation: RO filtration, ion exchange systems
PFAS (Per- and Polyfluoroalkyl Substances)
- Synthetic “forever chemicals” used in industrial processes and consumer products
- Health Impacts: Endocrine disruption, liver toxicity, increased cancer risk
- Regulation: No enforceable EPA MCL yet; provisional guidance 0.02–0.07 µg/L
Removal Technologies: Activated carbon adsorption, reverse osmosis
Volatile Organic Compounds (VOCs)
- Common VOCs: Benzene, trichloroethylene, toluene
- Sources: Industrial discharge, underground storage leaks
- Health Risks: Neurological effects, cancer potential
- Mitigation: Activated carbon filtration, advanced oxidation
Disinfection Byproducts (DBPs)
When water is disinfected with chlorine or chloramine, chemical reactions can form byproducts:
- Trihalomethanes (THMs)
- Haloacetic acids (HAAs)
Health Risks:
- Long-term exposure linked to cancer, liver and kidney toxicity
Mitigation:
- Point-of-entry (whole house) carbon filtration
- Alternative disinfection strategies (UV)
Emerging Contaminants
- Microplastics: Small plastic particles; unknown long-term health effects; ubiquitous in municipal water
- Pharmaceuticals: Trace residues from human and veterinary use; not fully regulated
- Endocrine Disruptors: Hormone-mimicking chemicals that may affect reproductive and metabolic health
Mitigation: Advanced carbon filters, reverse osmosis, and whole-house filtration systems
Contaminant Summary Table
| Contaminant Type | Examples | Health Impact | Common Sources | Recommended Removal |
|---|---|---|---|---|
| Microbial | E. coli, Giardia | Gastrointestinal illness | Surface water, wells | Boiling, UV, RO |
| Heavy Metals | Lead, Arsenic, Copper | Neurotoxicity, carcinogenic, GI upset | Pipes, groundwater | RO, distillation, carbon |
| Chemical | Nitrates, PFAS, VOCs | Blue baby syndrome, endocrine disruption, cancer | Fertilizers, industry | RO, carbon, ion exchange |
| Disinfection Byproducts | THMs, HAAs | Liver/kidney toxicity, cancer | Chlorine/chloramine reactions | POE/POU carbon |
| Emerging | Microplastics, Pharmaceuticals, Endocrine disruptors | Unknown/long-term risk | Consumer products, wastewater | RO, advanced carbon |
✅ Key Takeaways
- Water contains diverse contaminants: microbial, chemical, disinfection byproducts, and emerging pollutants.
- Each contaminant has specific health risks, sources, and removal strategies.
- Homeowners should test and adopt filtration strategies aligned with identified risks.
- This knowledge is foundational for understanding municipal vs well water safety and selecting appropriate filtration technologies in upcoming sections.
Municipal Water vs Well Water
Understanding the source of your drinking water is essential to evaluate risks, testing needs, and filtration strategies. Municipal (city) water and private wells differ in treatment processes, regulatory oversight, and contamination risks. This section provides a detailed comparison to guide homeowners in making informed decisions.
How Municipal Water Is Treated
Municipal water undergoes multiple treatment stages to meet EPA standards. Each step is designed to reduce specific contaminants and maintain water quality throughout distribution.
Key Treatment Steps
- Coagulation and Flocculation
- Chemicals (alum, iron salts) added to bind small particles into larger flocs
- Removes turbidity, sediments, and some microorganisms
- Sedimentation
- Flocs settle in large tanks; clarified water is collected
- Filtration
- Sand, gravel, and activated carbon remove remaining particles, organics, and some chemicals
- Disinfection
- Chlorine, chloramine, or UV light applied to inactivate microbes
- Residual disinfectants maintain water quality in distribution lines
- pH Adjustment and Corrosion Control
- Minimizes leaching of metals like lead from pipes
Private Well Water Systems
Private wells draw water directly from groundwater sources. Unlike municipal water, they are not regulated by the EPA, meaning homeowners are solely responsible for testing and maintenance.
Risk Factors for Well Water
- Geological contamination: Naturally occurring arsenic, radon, or fluoride
- Agricultural runoff: Nitrates, pesticides, and herbicides
- Septic systems: Bacterial contamination and nitrates
- Industrial pollution: Heavy metals, VOCs
Maintenance Responsibilities
- Regular testing for microbial and chemical contaminants
- Well disinfection and pump maintenance
- Seasonal water quality checks, especially after flooding or heavy rainfall
Risk Comparison Table: Municipal vs Well Water
| Feature | Municipal Water | Private Well Water |
|---|---|---|
| Regulation | EPA-regulated, CCR reports | Not regulated; homeowner responsibility |
| Treatment | Multi-stage: coagulation, filtration, disinfection | No treatment unless installed by homeowner |
| Common Contaminants | Lead (pipes), chlorine, DBPs, residual metals | Microbes, nitrates, arsenic, agricultural chemicals |
| Monitoring | Regular sampling by system | Occasional testing by homeowner |
| Reliability | High, consistent | Variable, dependent on source and maintenance |
Practical Considerations for Homeowners
- For municipal water users:
- Review Consumer Confidence Reports (CCRs)
- Consider point-of-use filters for lead, chlorine, PFAS
- For well water users:
- Test annually for bacteria, nitrates, and local chemical contaminants
- Install point-of-entry (whole house) or point-of-use filters as needed
- Decision-making framework:
- Identify water source
- Assess local contamination risk
- Determine testing frequency
- Match filtration technology to contaminants
✅ Key Takeaways
- Municipal water is treated and regulated, but residual contaminants may remain.
- Private well water is unregulated and requires proactive testing and maintenance.
- Understanding your water source is essential to determine the appropriate testing and filtration strategy.
- Risk-based decisions should combine source evaluation, local contamination data, and personal health considerations.
See our Smart Home pillar guide.
Water Testing Methods
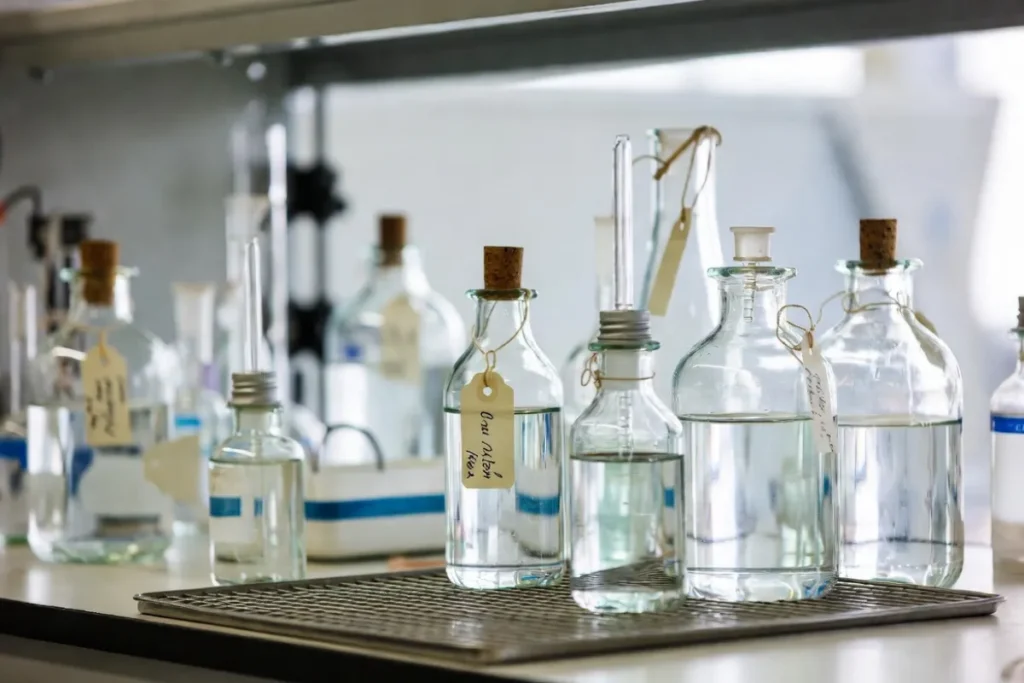
Testing is the foundation of informed water safety decisions. Without verified data, filtration choices are based on assumptions rather than evidence. Whether you rely on municipal water or a private well, understanding how to test, what to test for, and how to interpret results is essential.
This section provides a technical and practical framework for water testing at the household level.
Why Water Testing Is Essential
Even when water meets regulatory standards, localized contamination can occur due to:
- Aging plumbing infrastructure
- Household pipe corrosion
- Changes in source water chemistry
- Nearby agricultural or industrial activity
- Seasonal fluctuations (especially for wells)
Water testing transforms water safety from assumption to measurable verification.
Home Water Testing Kits
Home testing kits are widely available and offer a convenient first-level screening tool.
What Home Kits Typically Test For
Most multi-parameter kits detect:
- pH
- Hardness
- Nitrates
- Nitrites
- Iron
- Copper
- Lead (basic screening)
- Total coliform bacteria (presence/absence)
Some advanced kits also test for:
- Chlorine
- Fluoride
- TDS (Total Dissolved Solids)
Advantages
- Immediate results (minutes to days)
- Affordable
- Easy to use
- Good for routine monitoring
Limitations
- Often qualitative or semi-quantitative
- Less sensitive than laboratory testing
- Limited detection range
- Not reliable for trace contaminants like PFAS or microplastics
Home kits are best used as a screening tool, not definitive diagnosis.
Laboratory Water Testing
For accurate, trace-level detection of contaminants, certified laboratory testing is recommended.
When to Use Lab Testing
- Private well owners (annual testing minimum)
- If home kit shows elevated levels
- If household includes infants or pregnant individuals
- After flooding or plumbing changes
- If local contamination alerts are issued
What Laboratories Can Detect
Certified labs can test for:
- Heavy metals (lead, arsenic, cadmium)
- PFAS (parts-per-trillion detection)
- VOCs
- Disinfection byproducts
- Radon
- Microbial cultures
- Pharmaceuticals (specialized panels)
Laboratory testing provides quantitative results expressed in:
- Parts per billion (ppb)
- Parts per trillion (ppt)
- Milligrams per liter (mg/L)
These values can be directly compared with EPA MCLs or WHO guideline limits.
Understanding Water Test Results
Interpreting results correctly is as important as obtaining them.
Units of Measurement
- mg/L = milligrams per liter (roughly equivalent to ppm)
- µg/L = micrograms per liter (equivalent to ppb)
- ppt = parts per trillion (used for PFAS)
Comparing Results to Standards
Each contaminant should be evaluated against:
- EPA Maximum Contaminant Level (MCL)
- EPA Action Level (if applicable)
- WHO Guideline Value
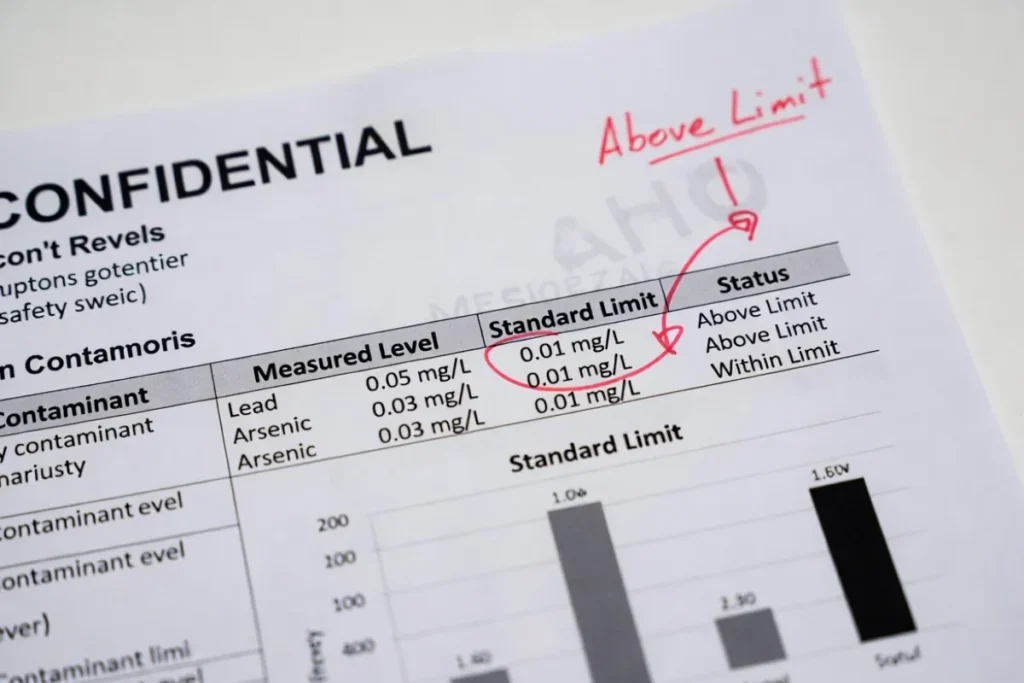
For example:
- Lead: Action level 15 ppb
- Arsenic: MCL 10 ppb
- Nitrate: MCL 10 mg/L
If results exceed these thresholds, remediation is recommended.
Risk-Based Interpretation
Important considerations:
- Chronic exposure risk (even below MCL for sensitive populations)
- Combined contaminant load
- Household-specific risk factors
Testing Frequency Recommendations
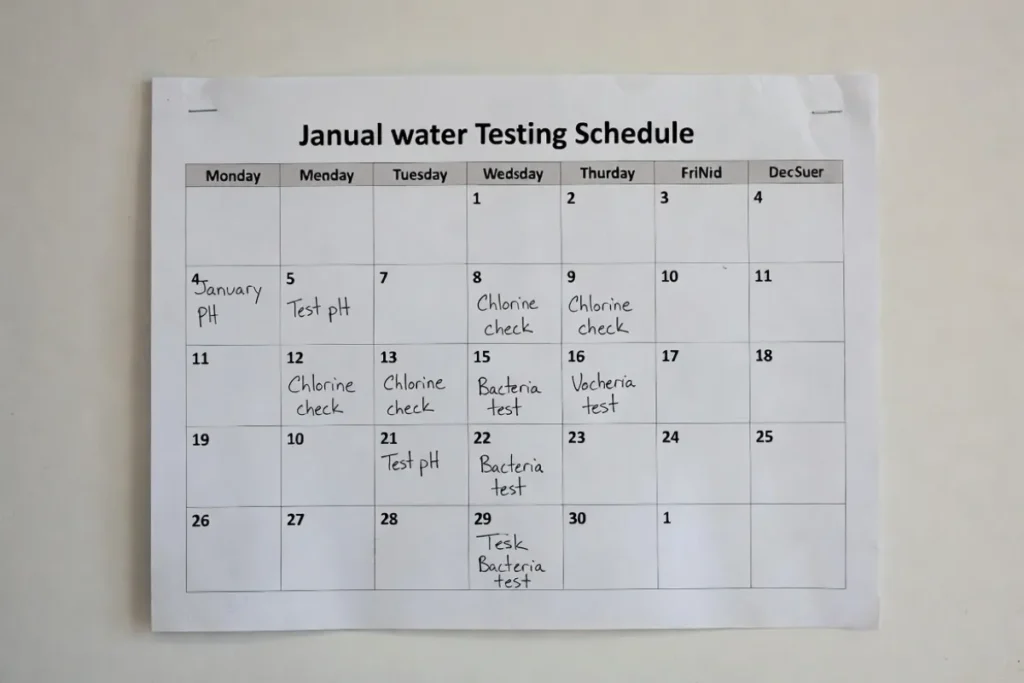
Municipal Water Users
- Review Consumer Confidence Report annually
- Test for lead if home built before 1986
- Additional testing if plumbing changes occur
Private Well Users
- Annual testing for bacteria and nitrates
- Every 3–5 years for heavy metals and chemicals
- Immediate testing after flooding or contamination events
From Testing to Action
Water testing should lead directly to mitigation planning:
- Identify contaminant
- Confirm level relative to standards
- Select appropriate filtration method
- Re-test after installation to verify effectiveness
This evidence-based approach prevents unnecessary filtration expenses while ensuring protection against verified risks.
✅ Key Takeaways
- Testing is essential for informed water safety decisions.
- Home kits provide screening; labs provide precise detection.
- Interpretation requires understanding regulatory limits and population risk.
- Testing should directly inform filtration strategy selection.
- Well owners must adopt proactive annual testing schedules.
Water Filtration Technologies Explained
Water filtration is not one-size-fits-all. Different contaminants require different treatment mechanisms. Selecting an appropriate system depends on verified test results, household size, plumbing layout, maintenance tolerance, and budget.
This section provides a technical breakdown of major residential water treatment technologies.
Activated Carbon Filtration
Activated carbon is one of the most widely used water treatment methods due to its effectiveness against chemical contaminants and its ability to improve taste and odor.
How It Works
Activated carbon removes contaminants through adsorption — a surface-binding process where chemicals adhere to porous carbon material.
Carbon filters are particularly effective for:
- Chlorine
- Chloramine (to varying degrees)
- Volatile organic compounds (VOCs)
- Disinfection byproducts (THMs, HAAs)
- Some PFAS (depending on carbon type and contact time)
Limitations
- Does not reliably remove dissolved heavy metals like arsenic
- Limited effectiveness for nitrates
- Ineffective for most microbes without additional treatment
- Filter saturation reduces performance over time
Maintenance
- Cartridge replacement every 2–6 months (varies by usage)
- Requires flow-rate adherence to ensure adequate contact time
Best Use Cases
- Municipal water with chlorine taste/odor concerns
- Low-to-moderate PFAS risk
- Supplemental treatment for whole-house systems
Reverse Osmosis (RO) Systems
Reverse osmosis is one of the most comprehensive point-of-use treatment methods available for residential applications.
How It Works
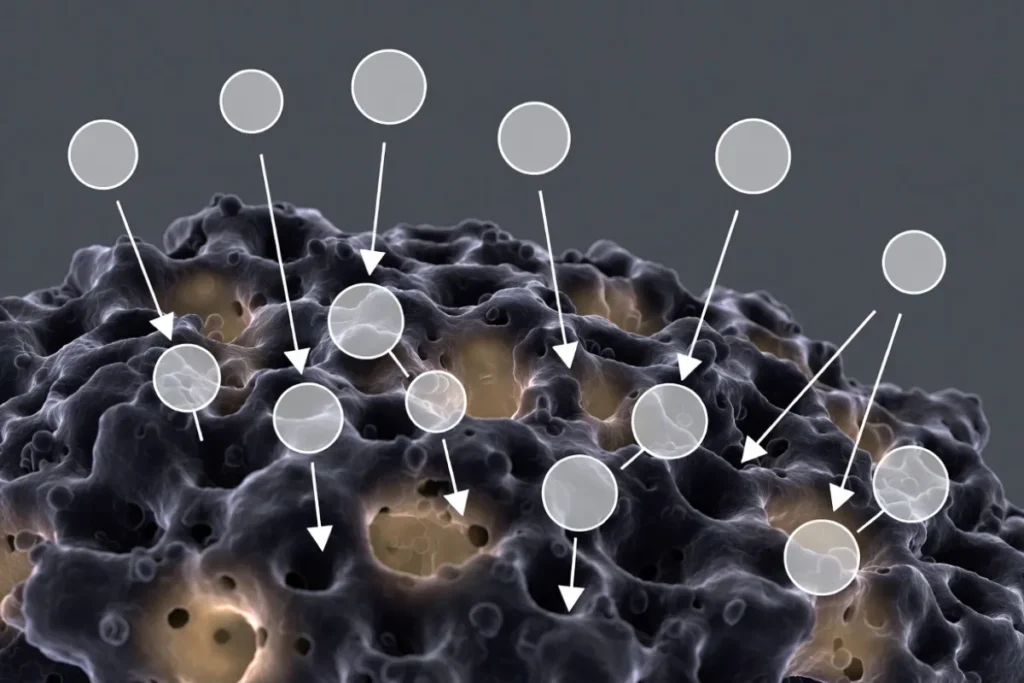
RO systems force water through a semi-permeable membrane that blocks dissolved solids and many chemical contaminants.
Effective removal includes:
- Lead
- Arsenic
- Nitrates
- PFAS
- Fluoride
- Many VOCs
- Total Dissolved Solids (TDS)
Wastewater Consideration
RO systems produce reject water:
- Typical residential ratio: 3:1 to 4:1 (waste:filtered)
- High-efficiency systems may reduce waste
Mineral Retention Discussion
RO removes both harmful contaminants and beneficial minerals such as calcium and magnesium. Some systems include remineralization cartridges to restore taste and mineral balance.
Maintenance
- Pre-filter replacement every 6–12 months
- Membrane replacement every 2–3 years
- Annual sanitation recommended
Best Use Cases
- Well water with heavy metal or nitrate contamination
- Homes with verified PFAS presence
- High TDS water
Ultraviolet (UV) Purification
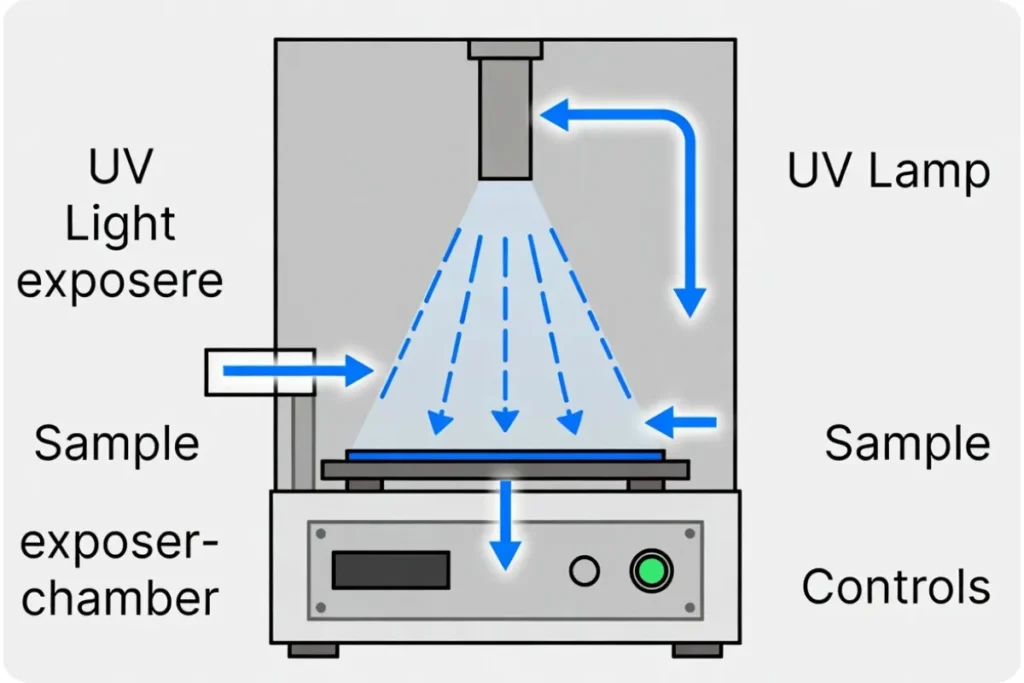
UV treatment disinfects water by inactivating microorganisms using ultraviolet light.
Effective Against
- Bacteria
- Viruses
- Parasites
Limitations
- Does not remove chemical contaminants
- Requires clear water (low turbidity)
- No residual protection after treatment
Maintenance
- Annual UV lamp replacement
- Quartz sleeve cleaning
Best Use Cases
- Private wells with microbial risk
- Supplemental system paired with carbon or RO
Ion Exchange Systems
Ion exchange systems replace undesirable ions in water with less harmful alternatives.
Common Applications
- Water softening (calcium & magnesium → sodium or potassium)
- Nitrate removal (specialized resins)
Limitations
- Does not remove microbes
- Requires salt regeneration
- Increases sodium content in softened water
Best Use Cases
- Hard water regions
- Nitrate contamination (specific systems)
Distillation
Distillation boils water and condenses steam into purified liquid.
Effective Against
- Heavy metals
- Salts
- Many inorganic contaminants
Limitations
- Slow production rate
- High energy use
- May not remove certain VOCs without carbon post-filter
Best Use Cases
- Small household volume
- High dissolved solid contamination
Whole House (Point-of-Entry) vs Point-of-Use Systems
Point-of-Entry (POE)
Installed where water enters the home.
Advantages:
- Treats all water (bathing, cooking, laundry)
- Reduces chlorine exposure during showers
- Protects plumbing and appliances
Limitations:
- Higher upfront cost
- May not remove all dissolved contaminants without multi-stage system
Point-of-Use (POU)
Installed at specific taps (typically kitchen sink).
Advantages:
- Targeted treatment
- Lower cost
- Highly effective for drinking water
Limitations:
- Does not treat shower or whole-house exposure
Contaminant Removal Matrix
| Contaminant | Carbon | RO | UV | Ion Exchange | Distillation |
|---|---|---|---|---|---|
| Chlorine | ✓ | ✓ | ✗ | ✗ | ✓ |
| Lead | Partial | ✓ | ✗ | ✗ | ✓ |
| Arsenic | Limited | ✓ | ✗ | ✗ | ✓ |
| Nitrates | ✗ | ✓ | ✗ | ✓ (specific) | ✓ |
| PFAS | Partial | ✓ | ✗ | ✗ | Limited |
| Bacteria | ✗ | ✓ | ✓ | ✗ | ✓ |
| VOCs | ✓ | ✓ | ✗ | ✗ | Partial |
| Hardness | ✗ | ✗ | ✗ | ✓ | ✓ |
Matching Technology to Test Results
The correct filtration system should be selected based on:
- Verified contaminants
- Concentration levels
- Household size and flow demand
- Maintenance capability
- Budget constraints
Avoid installing complex systems without evidence of contamination — targeted mitigation is more cost-effective and sustainable.
✅ Key Takeaways
- Activated carbon improves taste and removes many chemicals but has limitations.
- Reverse osmosis offers broad-spectrum removal but generates wastewater and requires maintenance.
- UV is effective for microbes but not chemicals.
- Ion exchange targets hardness and nitrates.
- Whole-house systems address full exposure; point-of-use systems focus on drinking water.
- Testing should guide filtration selection.
Reverse Osmosis vs Carbon Filtration
A Technical Comparison for Informed Decision-Making
Reverse osmosis (RO) and activated carbon are the two most commonly installed residential drinking water treatment technologies. While they are often marketed as interchangeable, they operate on fundamentally different scientific principles and address different risk profiles.
This section provides a side-by-side technical evaluation to help homeowners select the appropriate solution based on verified water quality data.
Fundamental Treatment Mechanisms
Activated Carbon — Adsorption-Based Treatment
Activated carbon removes contaminants through adsorption, a surface-binding process in which chemicals adhere to porous carbon media.
Key Characteristics:
- Targets organic chemicals
- Reduces chlorine and disinfection byproducts
- Improves taste and odor
- Limited dissolved mineral removal
Carbon filtration performance depends heavily on:
- Carbon type (granular vs block)
- Contact time
- Flow rate
- Maintenance schedule
Reverse Osmosis — Membrane Separation
Reverse osmosis uses pressure to force water through a semi-permeable membrane, separating dissolved contaminants from purified water.
Key Characteristics:
- Removes dissolved inorganic contaminants
- Reduces heavy metals and nitrates
- Highly effective for PFAS
- Lowers total dissolved solids (TDS)
RO is fundamentally a physical separation process, not adsorption.
Contaminant Removal Efficiency
| Contaminant | Activated Carbon | Reverse Osmosis |
|---|---|---|
| Chlorine | Excellent | Excellent |
| Chloramine | Moderate | Good |
| Lead | Limited/Certified models | Excellent |
| Arsenic | Limited | Excellent |
| Nitrates | Not effective | Excellent |
| PFAS | Partial (long-chain more effective) | High removal |
| VOCs | Excellent | Excellent |
| Microplastics | Partial | High removal |
| Hardness Minerals | No | Yes |
Key Insight:
If contamination involves dissolved inorganic substances (nitrates, arsenic, high TDS), reverse osmosis is generally more appropriate.
If the concern is primarily chlorine taste, odor, or organic chemicals, carbon filtration may be sufficient.
Water Waste & Environmental Considerations
Activated Carbon:
- No wastewater generation
- Low energy use
- Cartridge waste every replacement cycle
Reverse Osmosis:
- Produces reject water (typically 3:1 or 4:1 waste ratio)
- Requires water pressure or pump
- Membrane disposal every few years
High-efficiency RO systems reduce wastewater but do not eliminate it entirely.
Cost Comparison (Lifecycle Perspective)
| Factor | Carbon Filter | Reverse Osmosis |
|---|---|---|
| Initial Cost | Low to moderate | Moderate to high |
| Installation | Simple | More complex |
| Annual Maintenance | Cartridge replacement | Pre-filters + membrane |
| Energy Use | None | Minimal (unless pump-assisted) |
| Long-Term Cost | Lower | Higher |
Carbon systems are typically more affordable long-term for households without significant dissolved contaminant issues.
Taste and Mineral Profile
Carbon Filtration:
- Preserves natural minerals
- Improves taste by removing chlorine
- Maintains typical tap-water mouthfeel
Reverse Osmosis:
- Produces very low TDS water
- Can taste “flat” without remineralization
- Often paired with post-carbon filter for taste improvement
Some homeowners prefer RO water for perceived purity; others prefer mineral-retained taste from carbon systems.
Installation Complexity
Carbon Systems:
- Under-sink or countertop
- Minimal plumbing modification
- Suitable for renters (countertop models)
RO Systems:
- Under-sink installation
- Dedicated faucet required
- Drain line connection necessary
- Larger footprint
Whole-house carbon systems are common; whole-house RO systems are rare and expensive.
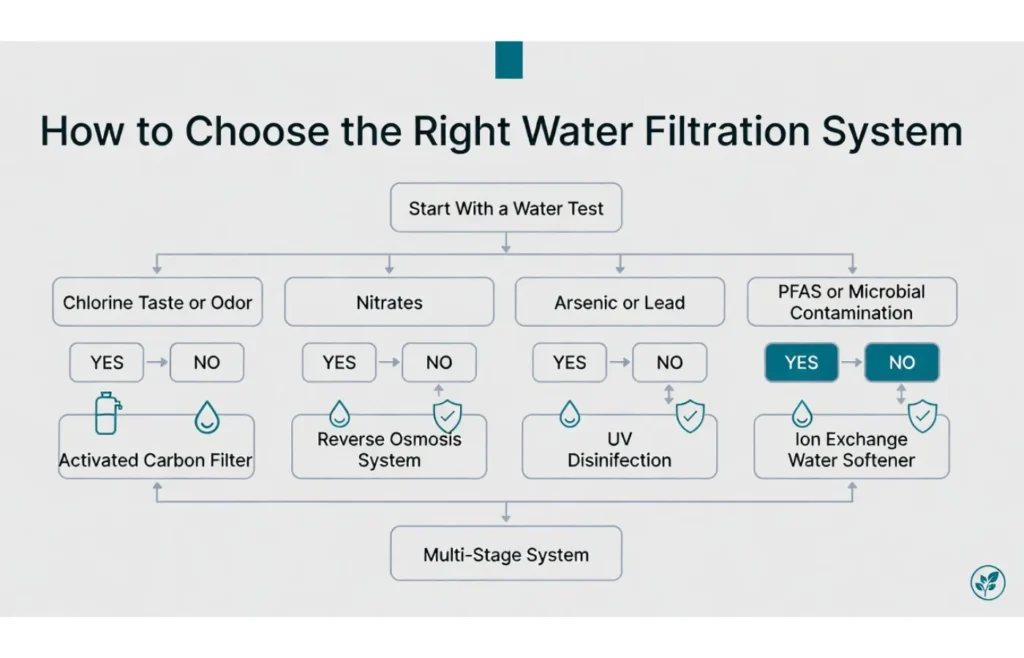
Ideal Use Case Decision Framework
Choose Activated Carbon If:
- Primary concern is chlorine taste/odor
- Municipal water is within regulatory compliance
- No known heavy metal or nitrate contamination
- Budget or space is limited
- Sustainability is a priority (no wastewater)
Choose Reverse Osmosis If:
- Water test confirms heavy metals, PFAS, or nitrates
- High TDS levels present
- Well water contamination risk
- Household includes infants or vulnerable individuals
- Maximum contaminant reduction is desired
Performance Verification & Certification
Regardless of technology choice, homeowners should verify:
- NSF/ANSI certification
- Contaminant-specific testing claims
- Replacement schedule transparency
- Manufacturer performance data
Certification standards vary by contaminant category (e.g., NSF 53 for health effects, NSF 58 for RO systems).
Strategic Recommendation
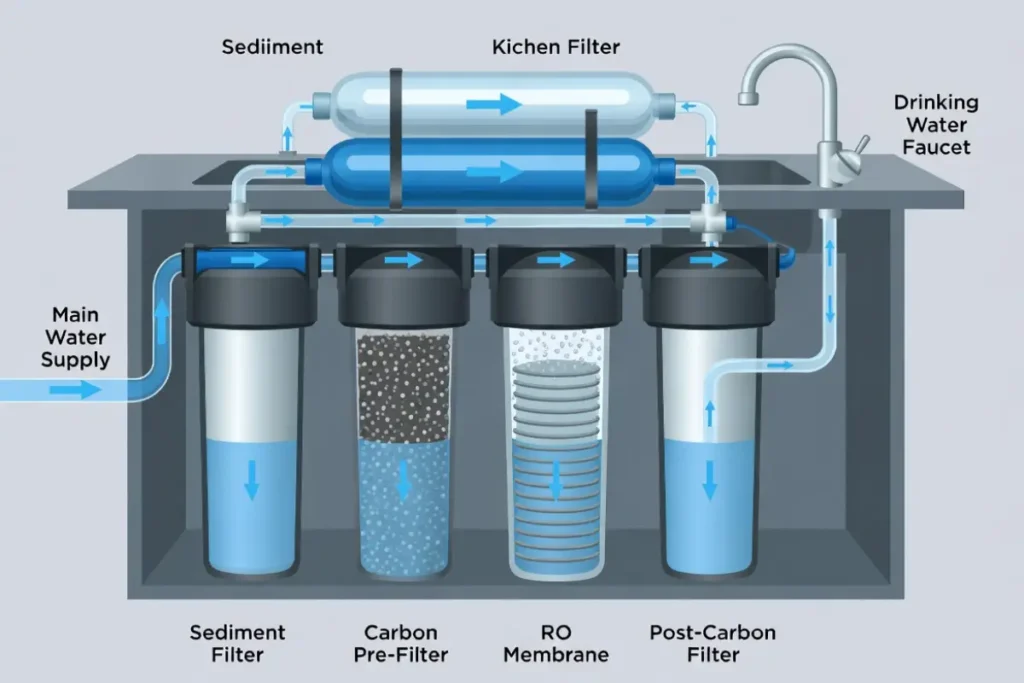
For many households, a multi-stage system combining carbon + RO provides optimal protection:
- Carbon pre-filter → chemical reduction
- RO membrane → dissolved contaminant removal
- Carbon post-filter → taste polishing
However, installing such systems without confirmed need may increase cost without proportional health benefit.
Testing should always precede installation.
✅ Key Takeaways
- Carbon and RO operate on different scientific principles.
- RO provides broader contaminant removal, especially for dissolved inorganic substances.
- Carbon is cost-effective and sufficient for chlorine and organic contaminants.
- Wastewater and maintenance considerations differ significantly.
- Testing should determine technology selection, not marketing claims.
PFAS, Lead, and Microplastics — A Deeper Technical Review
Certain contaminants generate disproportionate public concern due to their persistence, toxicity, and regulatory uncertainty. Among these, PFAS, lead, and microplastics represent three of the most discussed and researched categories in modern drinking water safety.
This section provides a deeper technical examination of their sources, exposure pathways, health evidence, evolving regulations, and removal strategies.
PFAS (Per- and Polyfluoroalkyl Substances)
PFAS are a class of thousands of synthetic chemicals used since the 1940s in:
- Firefighting foams
- Non-stick cookware
- Waterproof textiles
- Industrial manufacturing
They are commonly referred to as “forever chemicals” due to their extreme environmental persistence and resistance to degradation.
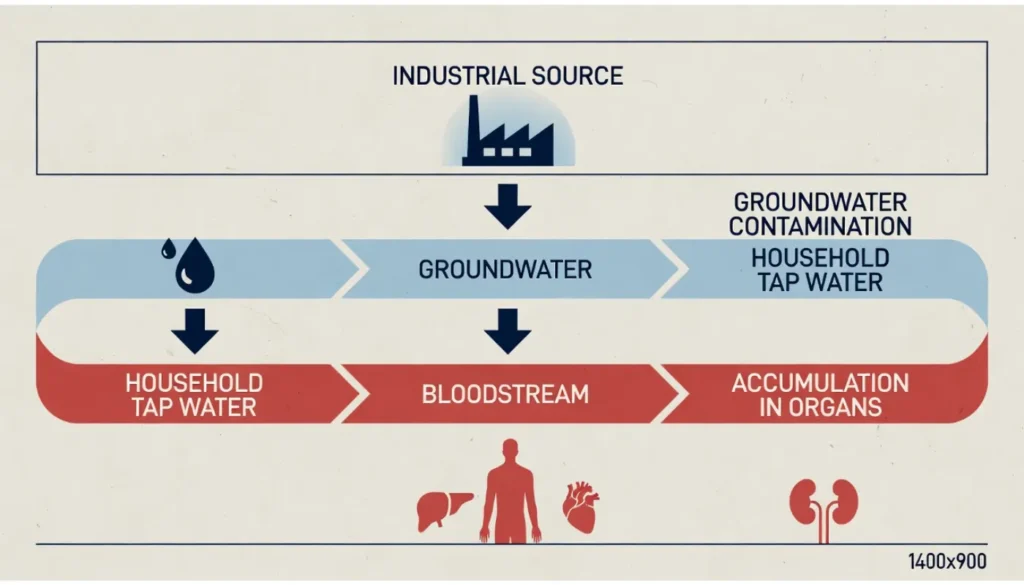
Environmental Pathways
PFAS enter drinking water through:
- Industrial discharge
- Firefighting training sites
- Landfill leachate
- Contaminated groundwater plumes
Because PFAS are highly mobile in water, they can travel long distances from the source.
Human Health Evidence
Research links long-term PFAS exposure to:
- Elevated cholesterol levels
- Thyroid dysfunction
- Immune system suppression
- Increased risk of certain cancers
- Developmental effects in infants
Notably, PFAS accumulate in the bloodstream over time, making chronic low-dose exposure a concern.
Regulatory Evolution
Regulation of PFAS is rapidly evolving.
- Historically unregulated at the federal level
- Recent EPA proposals aim to establish enforceable Maximum Contaminant Levels for PFOA and PFOS
- State-level standards often more stringent
PFAS regulation illustrates the concept of regulatory lag, where scientific evidence precedes enforceable standards.
Removal Effectiveness
| Technology | Effectiveness |
|---|---|
| Activated Carbon | Moderate (long-chain PFAS more effectively removed) |
| Reverse Osmosis | High removal efficiency |
| Ion Exchange (specialized) | High for specific PFAS |
System performance depends on concentration, contact time, and maintenance discipline.
Lead in Drinking Water
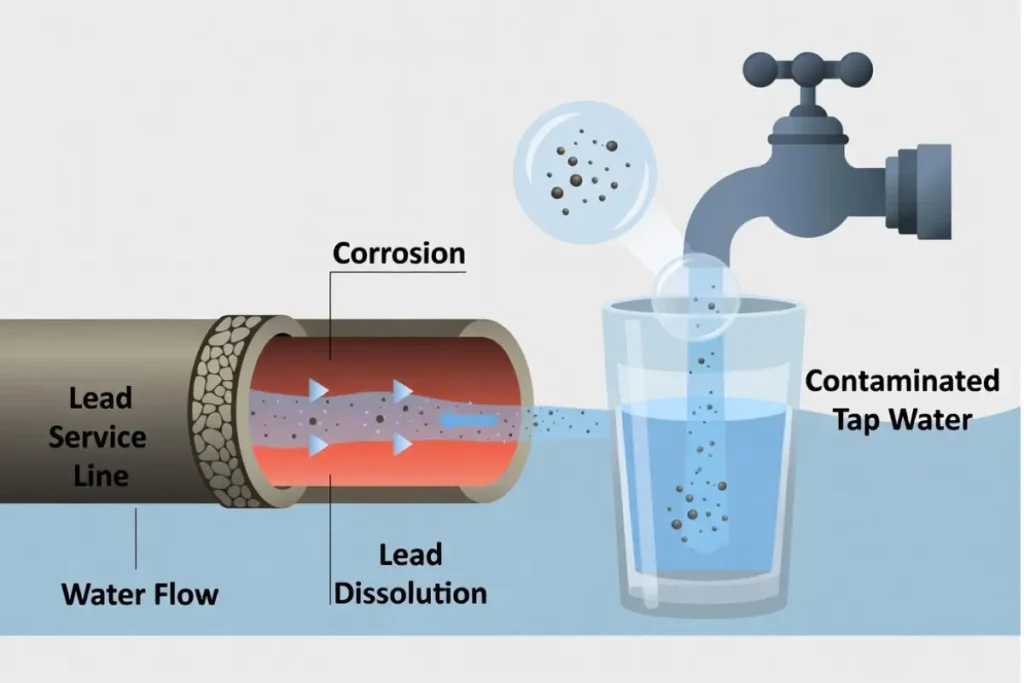
Lead contamination typically originates not from source water, but from plumbing infrastructure.
Sources of Lead Exposure
- Lead service lines (pre-1986 construction common risk)
- Brass fixtures and solder
- Corrosive water chemistry
Corrosion control treatment helps minimize leaching, but does not eliminate infrastructure risk.
Health Impact — No Safe Level
Lead exposure is particularly harmful to:
- Infants and young children
- Pregnant individuals
Health risks include:
- Neurodevelopmental delays
- Reduced IQ
- Behavioral changes
- Cardiovascular effects in adults
Public health agencies recognize that no safe blood lead level exists.
Action Levels vs True Safety
The EPA action level (15 ppb) triggers remediation but does not imply safety below that threshold. Sensitive populations may be affected at lower levels.
Effective Removal
| Technology | Effectiveness |
|---|---|
| Certified Carbon (NSF 53) | Effective |
| Reverse Osmosis | Highly effective |
| Distillation | Effective |
Flushing pipes before use can reduce short-term exposure but is not a permanent solution.
Microplastics in Drinking Water
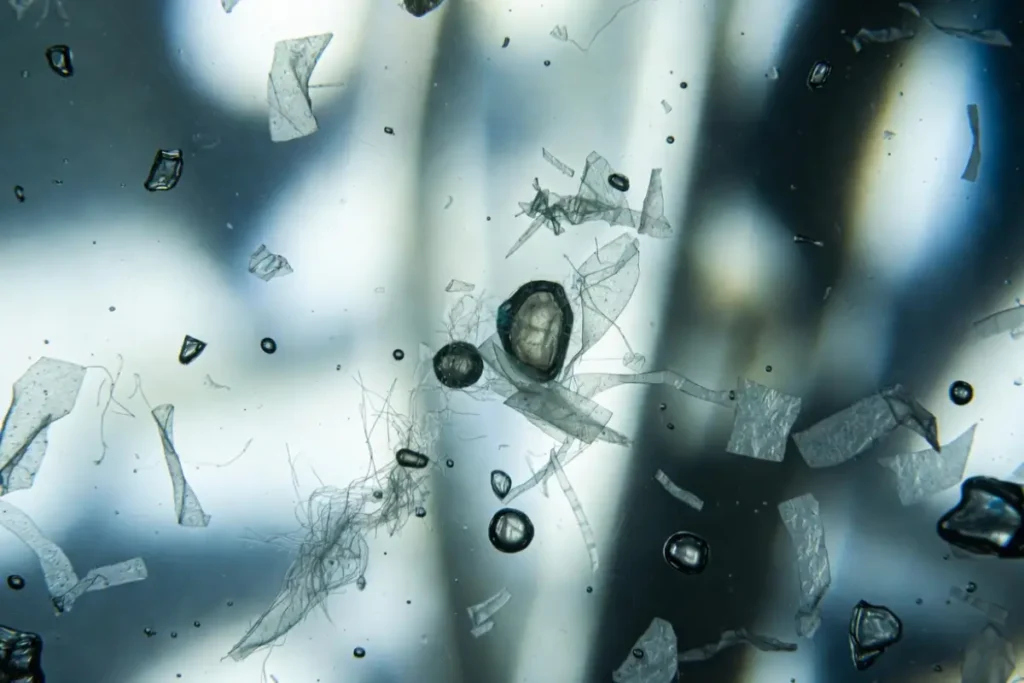
Microplastics are plastic particles smaller than 5 millimeters, originating from:
- Degraded consumer plastics
- Textile fibers
- Industrial waste
- Bottled water packaging
They have been detected in both municipal tap water and bottled water globally.
Health Research Status
Unlike lead or PFAS, microplastics remain an emerging research area.
Potential concerns include:
- Physical irritation of tissues
- Chemical leaching from plastic additives
- Interaction with other contaminants
Current research has not established definitive long-term human health outcomes, but precautionary approaches are increasing.
Detection Challenges
- No standardized testing methodology universally adopted
- Particle size variability complicates quantification
- Often not included in routine municipal water reports
Removal Potential
| Technology | Effectiveness |
|---|---|
| Carbon | Partial (depending on particle size) |
| Reverse Osmosis | High removal |
| Ultrafiltration | Effective for larger particles |
Comparative Risk Perspective
While public discourse often amplifies emerging contaminants, risk prioritization should be based on:
- Verified concentration levels
- Toxicological evidence strength
- Exposure duration
- Vulnerable population presence
Lead presents immediate neurodevelopmental risk.
PFAS presents long-term bioaccumulation risk.
Microplastics represent emerging but not yet fully quantified risk.
Balanced evaluation prevents unnecessary alarm while encouraging evidence-based mitigation.
Strategic Mitigation Framework
If testing confirms:
- Lead → Install certified carbon or RO; inspect plumbing
- PFAS → RO or specialized carbon; monitor evolving regulations
- Microplastics → RO or fine membrane filtration
Re-test after installation to confirm removal efficiency.
✅ Key Takeaways
- PFAS are persistent and bioaccumulative, with evolving regulation.
- Lead poses significant neurological risk with no safe exposure threshold.
- Microplastics are widespread but still under active research.
- Removal effectiveness varies by technology and maintenance quality.
- Testing and targeted treatment remain the cornerstone of risk reduction.
Choosing the Right Water Treatment Strategy for Your Home
Effective water treatment begins with data, not assumptions.
There is no universally “best” filtration system. The appropriate solution depends on:
- Source water (municipal vs private well)
- Contaminant profile
- Household composition
- Plumbing infrastructure
- Budget and maintenance capacity
- Health sensitivities
This section provides a structured decision-making framework aligned with environmental health best practices.
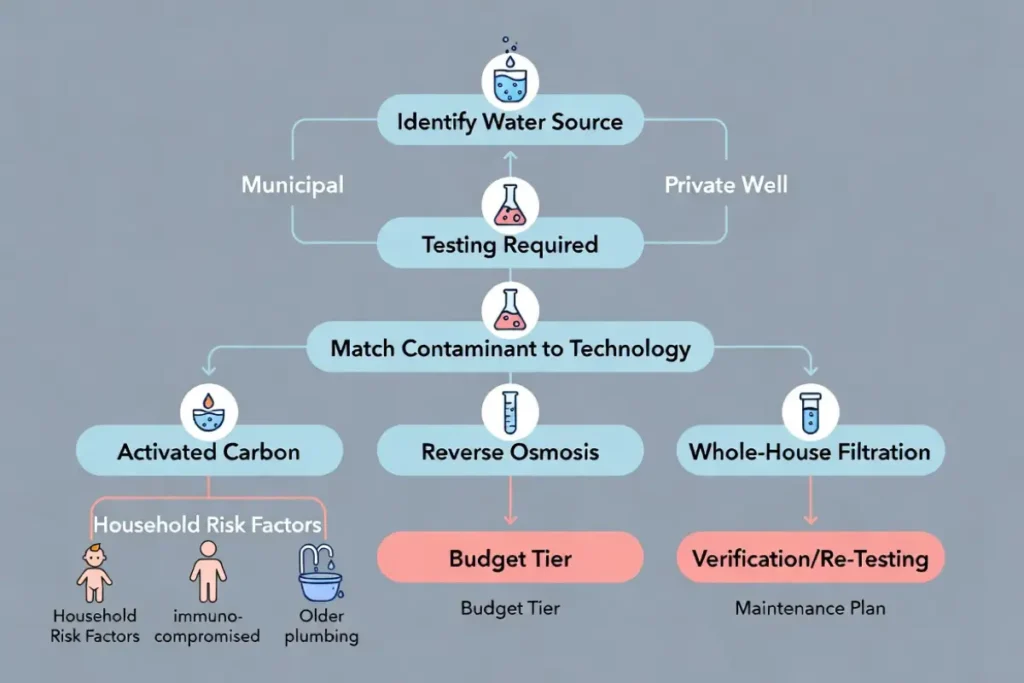
Step 1 — Identify Your Water Source and Risk Profile
Municipal Water Households
Municipal systems are regulated under the Safe Drinking Water Act and must meet Maximum Contaminant Levels (MCLs).
However, residual risk may include:
- Chlorine or chloramine byproducts
- Disinfection byproducts (DBPs)
- PFAS (depending on region)
- Lead from household plumbing
- Microplastics (not routinely monitored)
Action Step: Review your annual Consumer Confidence Report (CCR) and cross-reference it with independent testing if necessary.
Private Well Households
Private wells are not federally regulated. Risk depends on:
- Geological characteristics
- Agricultural runoff
- Septic system proximity
- Industrial contamination
- Well depth and construction integrity
Common well contaminants:
- Nitrates
- Arsenic
- Iron and manganese
- Bacteria
- Hardness
Action Step: Perform comprehensive laboratory testing at least annually, and after flooding or major environmental events.
Step 2 — Conduct Water Testing Before Choosing Treatment
System selection without testing often leads to:
- Overspending
- Under-treatment
- Incorrect filtration method
- False confidence
Testing tiers:
| Scenario | Recommended Testing Level |
|---|---|
| Routine municipal check | Basic + lead |
| Infant in household | Lead + nitrate |
| Well water | Comprehensive panel |
| Known regional PFAS | PFAS-specific test |
| Health sensitivity | Full spectrum analysis |
Testing results determine contaminant concentration and required removal efficiency.
Step 3 — Match Contaminant Type to Treatment Technology
When Activated Carbon Is Appropriate
Best for:
- Chlorine
- Taste and odor issues
- Some pesticides
- Many volatile organic compounds
- Certain PFAS (especially long-chain types)
Carbon systems are cost-effective and improve sensory quality but may not remove dissolved inorganic contaminants like arsenic or nitrates.
When Reverse Osmosis Is Appropriate
Best for:
- Lead
- Arsenic
- Nitrates
- PFAS
- Fluoride
- Many heavy metals
RO provides broad-spectrum removal but:
- Wastes some water during filtration
- Requires membrane replacement
- Produces slower output flow
When Whole-House Filtration Is Appropriate
Consider whole-house systems when:
- Water contains sediment
- Hardness affects plumbing
- Iron or sulfur odor is present
- Contaminants affect bathing or appliances
Point-of-entry systems treat all water entering the home but are more expensive and require professional installation.
Step 4 — Evaluate Household-Specific Risk Factors
Infants and Pregnant Individuals
Higher sensitivity to:
- Lead
- Nitrates
- PFAS
Testing and treatment should prioritize these contaminants.
Immunocompromised Individuals
Greater vulnerability to:
- Microbial contamination
- Bacterial outbreaks
- Parasites
Well users should consider UV disinfection if bacterial risk exists.
Older Plumbing Infrastructure
Homes built before 1986 may have:
- Lead service lines
- Lead solder
In such cases, lead testing and certified removal systems are strongly advised.
Step 5 — Budget Tier Strategy
Environmental health solutions must be sustainable financially to remain effective long-term.
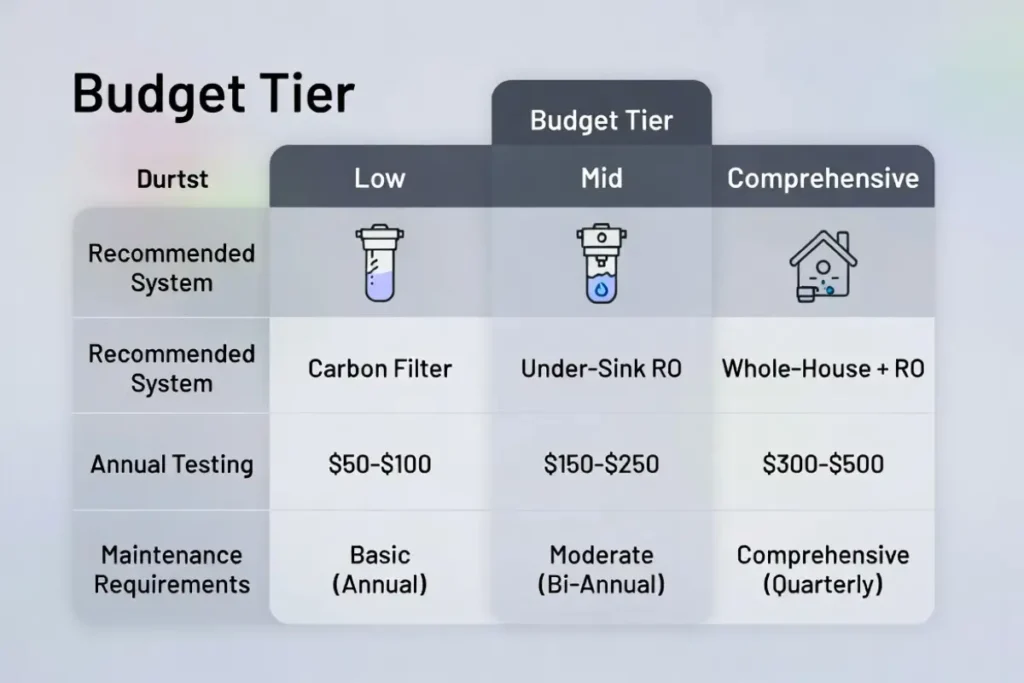
Budget-Conscious Approach
- Certified carbon pitcher or faucet filter
- Targeted lead removal
- Annual testing
Best for low-to-moderate risk municipal water.
Mid-Range Strategy
- Under-sink reverse osmosis system
- Sediment pre-filter
- Annual lab testing
Appropriate for mixed contaminant profiles.
Comprehensive Strategy
- Whole-house sediment filtration
- Water softener (if needed)
- Under-sink RO for drinking
- Annual laboratory panel
Best for well users or complex contamination profiles.
Step 6 — Maintenance Planning
A filtration system is only effective if properly maintained.
Maintenance includes:
- Cartridge replacement schedules
- Membrane replacement (RO systems)
- Sanitization of housings
- Monitoring pressure and flow rate
- Periodic re-testing of water
Failure to maintain systems may lead to:
- Bacterial growth
- Breakthrough contamination
- Decreased removal efficiency
Environmental health protection is an ongoing process, not a one-time purchase.
Step 7 — Verification and Re-Testing
After installing treatment:
- Re-test water within 30–90 days
- Confirm contaminant reduction meets expected levels
- Adjust filtration stages if needed
This closes the exposure control loop and transforms filtration from assumption to evidence-based intervention.
Decision Framework Summary
- Identify source
- Test comprehensively
- Match technology to contaminants
- Consider vulnerable populations
- Select financially sustainable solution
- Maintain properly
- Verify through re-testing
This structured model prevents oversimplified “one-size-fits-all” solutions.
EPA Standards, WHO Guidelines, and What They Actually Mean
Water quality regulations are often misunderstood.
Terms such as “meets federal standards” or “within safe limits” can create a false sense of certainty if not properly interpreted. Regulatory limits are based on a combination of toxicology, feasibility, detection capability, and cost-benefit analysis — not purely on zero-risk thresholds.
Understanding these frameworks allows individuals to interpret water reports accurately and make informed decisions.
The U.S. Regulatory Framework — Safe Drinking Water Act
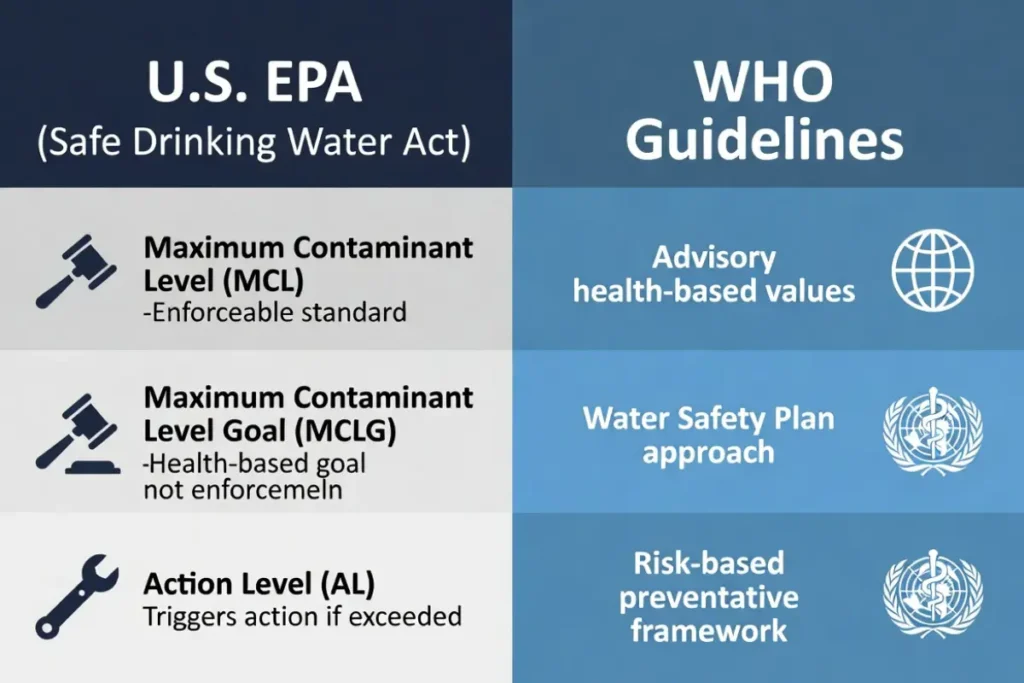
In the United States, drinking water standards are governed by the Safe Drinking Water Act (SDWA), administered by the U.S. Environmental Protection Agency.
The EPA sets:
- Maximum Contaminant Levels (MCLs)
- Maximum Contaminant Level Goals (MCLGs)
- Action Levels (ALs)
- Treatment Techniques (TTs)
Each term has a distinct regulatory and health meaning.
Maximum Contaminant Levels (MCLs)
An MCL is the highest concentration of a contaminant legally allowed in public drinking water systems.
MCLs are enforceable standards.
However, they are determined by balancing:
- Toxicological data
- Analytical detection limits
- Treatment feasibility
- Economic impact
Important Clarification:
An MCL is not a zero-risk threshold. It is the maximum legally permitted concentration based on what is currently achievable for large systems.
Example — Arsenic
The EPA MCL for arsenic is 10 parts per billion (ppb).
This limit reflects:
- Epidemiological cancer data
- Feasibility of treatment technologies
- National infrastructure constraints
Lower concentrations may still carry incremental risk, particularly with lifetime exposure.
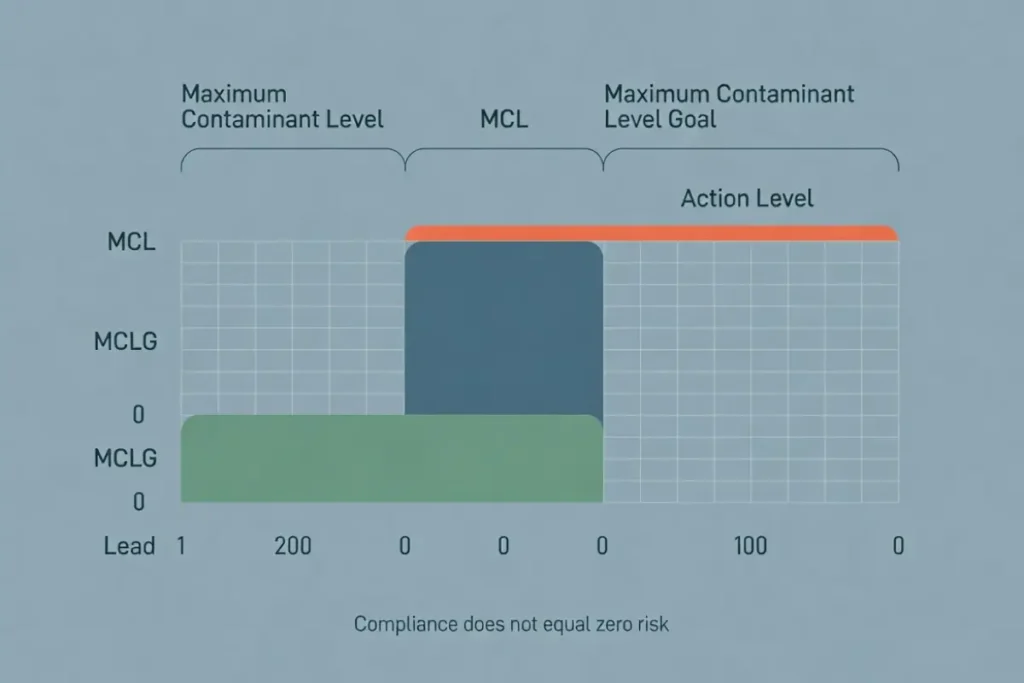
Maximum Contaminant Level Goals (MCLGs)
An MCLG represents a non-enforceable health goal.
It is based solely on health risk, without considering treatment cost or practicality.
For some contaminants:
- MCLG = 0 (for example, lead and certain carcinogens)
This means no level is considered completely risk-free, even if the enforceable limit is higher.
Understanding the gap between MCLG and MCL is essential for interpreting risk conservatively.
Action Levels (ALs)
Some contaminants, such as lead, use an Action Level instead of an MCL.
An Action Level triggers required corrective action if exceeded in more than a specified percentage of samples.
For example:
- Lead Action Level: 15 ppb
If more than 10% of sampled homes exceed this level, utilities must:
- Optimize corrosion control
- Notify the public
- Replace lead service lines (under updated rules)
However, lead exposure below the Action Level can still pose risk, particularly to children.
Treatment Techniques (TTs)
When it is not feasible to measure a contaminant reliably, the EPA may require specific treatment processes instead of setting a numeric limit.
Examples include:
- Filtration requirements for surface water
- Disinfection protocols
- Corrosion control mandates
Treatment Techniques are process-based safeguards rather than concentration-based thresholds.
WHO Guidelines for Drinking-Water Quality
Globally, many countries reference guidance from the World Health Organization.
WHO guidelines differ from EPA standards in key ways:
- They are advisory, not legally binding.
- They often include more conservative health-based targets.
- They consider global variability in infrastructure capacity.
WHO emphasizes a “Water Safety Plan” approach:
- Risk assessment from source to tap
- Hazard control measures
- Ongoing monitoring
This preventative systems-based model is increasingly adopted worldwide.
Differences Between U.S. and International Standards
Regulatory limits can vary between countries due to:
- Different toxicological interpretations
- Infrastructure feasibility
- Economic considerations
- Climate and regional contamination patterns
For example:
- Some European Union limits for pesticides are more stringent than U.S. limits.
- PFAS standards are evolving globally, with certain countries adopting lower thresholds.
Variability does not necessarily indicate inconsistency in science — it often reflects policy and feasibility differences.
Regulatory Lag and Emerging Contaminants
Science evolves faster than regulation.
Emerging contaminants such as:
- PFAS
- Microplastics
- Certain pharmaceuticals
may be detected in water long before enforceable limits are established.
Regulatory lag occurs because:
- Long-term toxicology studies require time
- Public comment and rulemaking processes are extensive
- Infrastructure upgrades are costly
This is why personal water testing and targeted filtration may exceed minimum regulatory compliance in some households.
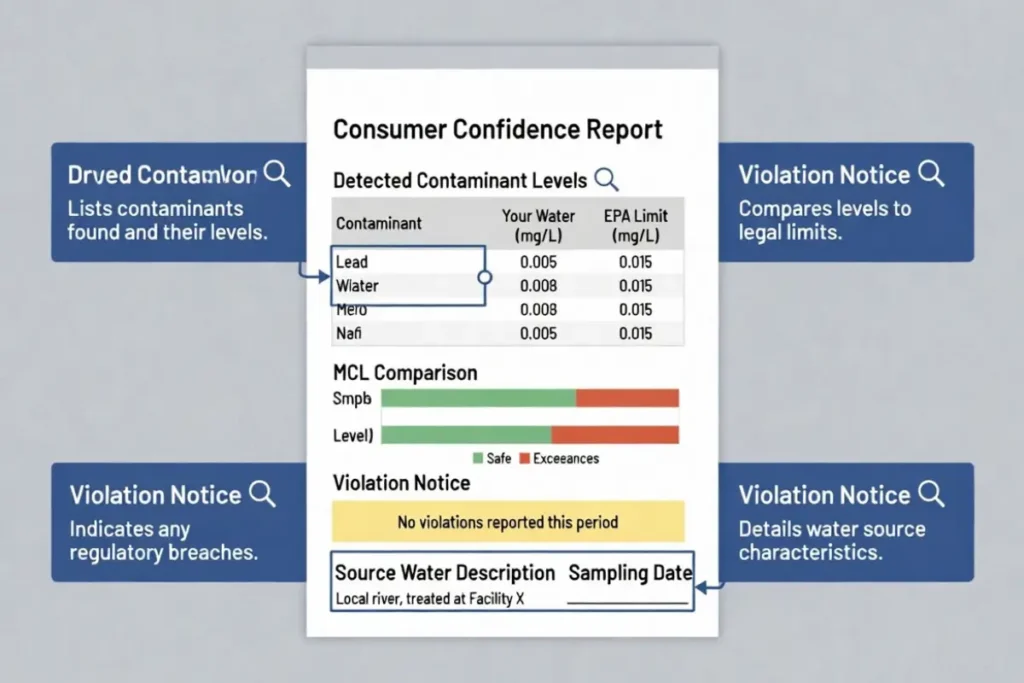
Understanding a Consumer Confidence Report (CCR)
Municipal water systems publish annual water quality reports.
Key components include:
- Detected contaminant levels
- MCL comparison
- Violation notices
- Source water description
- Treatment methods
When reviewing a CCR:
- Compare reported levels to MCLG, not just MCL.
- Look for contaminants tested but not detected.
- Check sampling dates.
- Note if violations occurred.
A CCR reflects system-wide averages — not necessarily water at your specific tap.
Health-Based Risk vs Regulatory Compliance
Compliance does not equal zero risk.
Environmental health decisions may consider:
- Sensitive populations
- Cumulative exposure
- Multiple contaminant interactions
- Lifetime intake
For example:
A contaminant at 80% of its MCL may be legally compliant but still relevant for households with infants or immunocompromised individuals.
Interpreting “Below Detection Limits”
Water reports may list contaminants as “ND” (not detected).
Important distinctions:
- Not detected does not mean zero presence.
- It means below the analytical detection threshold.
- Detection limits vary by laboratory method.
Improved testing technologies may reveal lower concentrations in the future.
Risk Communication and Public Perception
Water quality communication must balance:
- Transparency
- Scientific nuance
- Avoidance of alarmism
Overstating risk can create unnecessary fear.
Understating regulatory gaps can create complacency.
Authority-level environmental health communication emphasizes:
- Evidence
- Context
- Actionable clarity
Key Takeaways
- MCLs are enforceable limits, not zero-risk guarantees.
- MCLGs represent health-based goals without feasibility constraints.
- Action Levels trigger intervention but do not define safety thresholds.
- WHO guidelines provide global, advisory health benchmarks.
- Regulatory lag exists for emerging contaminants.
- Understanding water reports empowers informed decisions.
Long-Term Water Quality Management and Preventative Strategy
Water safety is not a one-time decision. It is an ongoing environmental health process influenced by infrastructure aging, climate variability, regulatory changes, and household dynamics.
Long-term management integrates monitoring, maintenance, risk reassessment, and adaptation over time.
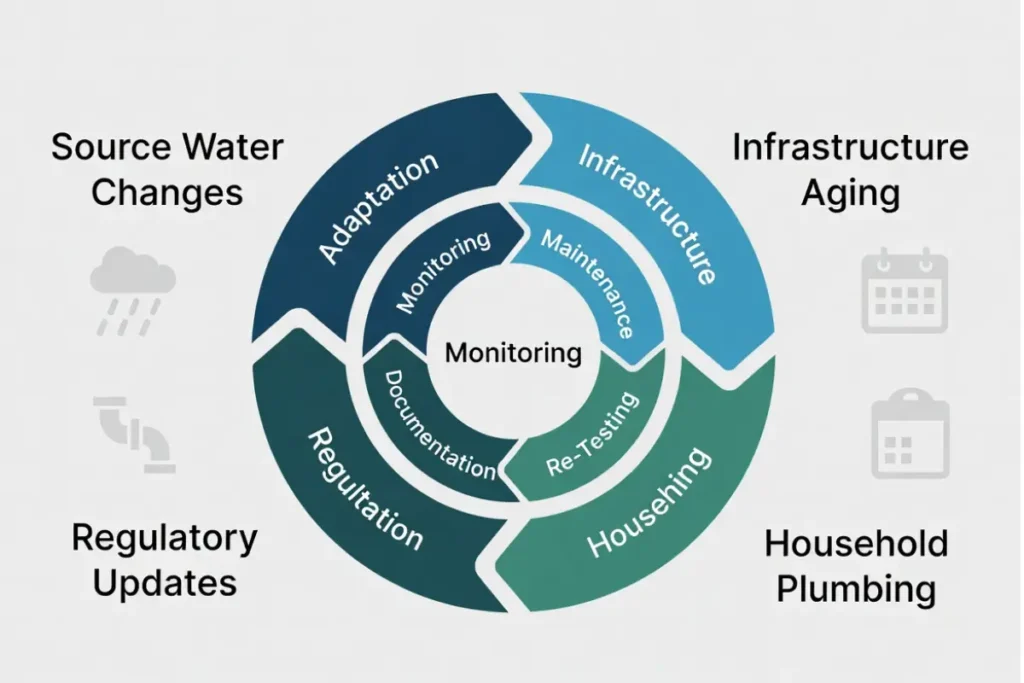
The Lifecycle Model of Water Quality Risk
Water risk evolves across four interacting domains:
- Source water changes
- Distribution system aging
- Household plumbing deterioration
- Regulatory updates
A system that is safe today may require reassessment in five to ten years.
Environmental health planning therefore requires periodic review, not static assumptions.
Seasonal and Environmental Variability
Water quality can fluctuate seasonally.
Heavy Rainfall and Flooding
Increased precipitation can:
- Elevate turbidity in surface water
- Mobilize agricultural runoff (nitrates, pesticides)
- Increase microbial contamination risk
- Stress treatment facilities
Private wells are particularly vulnerable after flooding events.
Recommended action:
- Re-test well water after major storms
- Inspect well casing integrity
Drought Conditions
Reduced water volume can:
- Concentrate dissolved contaminants
- Increase salinity
- Stress municipal supply systems
Drought can alter source blending strategies used by utilities, potentially changing mineral or disinfectant levels.
Temperature Changes
Warmer temperatures can:
- Accelerate microbial growth
- Increase formation of disinfection byproducts
- Influence corrosion chemistry
Monitoring seasonal trends improves long-term risk awareness.
Aging Infrastructure and Corrosion Dynamics
Across many developed regions, water infrastructure is decades old.
Risks include:
- Lead service lines
- Corroding cast iron pipes
- Biofilm accumulation
- Distribution system leaks
Corrosion control programs reduce risk but are not fail-proof.
Homes built before 1986 should remain vigilant for lead exposure risk, especially after plumbing repairs or municipal water chemistry changes.
Periodic first-draw lead testing is advisable in older homes.
Climate Change and Emerging Risk Patterns
Climate change influences water safety through:
- Increased flooding events
- Harmful algal blooms
- Drought-induced concentration effects
- Infrastructure stress
Harmful algal blooms can produce cyanotoxins that require advanced treatment beyond standard disinfection.
Long-term environmental health planning must consider regional climate projections.
Private Well Stewardship Strategy
Private well owners function as their own water utility managers.
Best practice framework:
- Annual comprehensive lab testing
- Additional testing after flooding
- Septic system inspection every 3–5 years
- Well cap inspection annually
- Shock chlorination if bacterial contamination detected
Documentation of results creates a longitudinal water quality profile.
Municipal Water Households — Ongoing Oversight
Even in regulated systems, proactive oversight strengthens protection.
Recommended actions:
- Review annual Consumer Confidence Report
- Monitor local water utility announcements
- Test tap water for lead periodically
- Replace faucet aerators regularly
- Flush taps after extended stagnation
Residents should stay informed about infrastructure upgrades and service line replacement programs.
Filtration System Lifecycle Management
Cartridge Replacement Scheduling
Failure to replace filters can result in:
- Breakthrough contamination
- Reduced flow rate
- Microbial growth inside housings
Replacement frequency depends on:
- Water usage volume
- Sediment load
- Manufacturer specifications
Calendar-based reminders prevent lapses.
Reverse Osmosis Membrane Monitoring
RO membranes gradually lose efficiency.
Indicators for replacement:
- Decreased output pressure
- Elevated total dissolved solids (TDS) in filtered water
- Manufacturer recommended timeframe (typically 2–5 years)
Periodic TDS meter testing helps verify performance.
Whole-House System Inspection
Professional inspection may be advisable every 2–3 years for:
- Pressure tanks
- Softener resin performance
- UV lamp function
- Backwash operation
Preventative maintenance reduces unexpected failures.
Documentation and Data Tracking
Maintaining a water quality file enhances long-term oversight.
Include:
- Laboratory reports
- Installation dates
- Filter change logs
- Municipal notices
- Plumbing repair documentation
Data tracking supports evidence-based decisions rather than reactive responses.
Household Risk Audit Checklist
Annual review questions:
- Has household composition changed (new infant, pregnancy, aging residents)?
- Has plumbing been modified?
- Have local contamination advisories been issued?
- Has filtration been maintained consistently?
- Has climate variability affected the region?
A structured audit promotes proactive health protection.
When to Consult a Professional
Professional consultation may be warranted when:
- Lab results exceed regulatory limits
- Multiple contaminants are detected
- Well water contamination persists
- Health symptoms raise exposure concerns
- Major plumbing renovations are planned
Environmental health specialists or certified water treatment professionals can interpret complex profiles and recommend targeted solutions.
The Preventative Mindset
Long-term water safety is achieved through:
- Monitoring
- Maintenance
- Adaptation
- Documentation
This mindset shifts water treatment from a product purchase to a health management system.
Key Takeaways
- Water risk evolves over time due to environmental and infrastructure factors.
- Seasonal variability affects contaminant levels.
- Climate change introduces new water safety considerations.
- Well owners must actively manage testing and maintenance.
- Filtration systems require scheduled oversight.
- Annual household audits support preventative protection.
Frequently Asked Questions About Drinking Water Quality
Is Tap Water Safe to Drink?
In most developed countries, municipal tap water must meet regulatory standards set by the U.S. Environmental Protection Agency or comparable national authorities.
However, “meeting standards” does not guarantee zero risk. Factors such as aging plumbing, lead service lines, emerging contaminants, and seasonal variability can influence water quality at the tap.
The safest approach is to:
- Review your annual water quality report
- Test your household tap water when appropriate
- Install targeted filtration if needed
What Is the Difference Between MCL and MCLG?
A Maximum Contaminant Level (MCL) is a legally enforceable limit for contaminants in public drinking water.
A Maximum Contaminant Level Goal (MCLG) is a non-enforceable health target based purely on toxicological data.
MCLGs are often set at zero for carcinogens or neurotoxins, while MCLs reflect practical treatment feasibility and infrastructure constraints.
Should I Test My Municipal Water?
Municipal water systems conduct regular testing, but:
- Sampling is system-wide, not specific to your home
- Lead contamination often originates in household plumbing
- Emerging contaminants may not be fully regulated
Testing is particularly advisable if:
- Your home was built before 1986
- You have infants or pregnant individuals
- You notice taste, odor, or discoloration changes
How Often Should Private Well Water Be Tested?
Private wells should be tested:
- Annually for bacteria and nitrates
- Every 2–3 years for heavy metals and broader contaminants
- Immediately after flooding
- After plumbing repairs
Because private wells are not regulated, routine testing is essential.
What Contaminants Are Most Concerning in Drinking Water?
Concern depends on concentration and exposure duration, but commonly discussed contaminants include:
- Lead
- Arsenic
- PFAS
- Nitrates
- Disinfection byproducts
- Microbial pathogens
Health risk varies by age, pregnancy status, and overall health.
Is Bottled Water Safer Than Tap Water?
Not necessarily.
Bottled water may:
- Contain microplastics
- Lack transparency in testing data
- Be regulated differently
Some bottled water originates from municipal sources and undergoes additional filtration.
Long-term reliance on bottled water does not eliminate potential exposure and may increase cost and environmental impact.
Do Water Filters Remove All Contaminants?
No single filter removes every contaminant.
Effectiveness depends on:
- Filter type
- Certification standard
- Contaminant chemistry
- Maintenance schedule
For example:
- Activated carbon reduces chlorine and many organic compounds.
- Reverse osmosis removes dissolved solids and heavy metals.
- UV systems inactivate microbes but do not remove chemicals.
Selecting a system requires contaminant-specific matching.
What Is the Best Water Filtration System?
There is no universal “best” system.
The appropriate choice depends on:
- Test results
- Household composition
- Budget
- Maintenance capacity
For many households, a reverse osmosis system for drinking water combined with sediment pre-filtration offers broad-spectrum protection.
However, simpler carbon filtration may be sufficient in low-risk municipal systems.
Can Boiling Water Remove Chemicals?
Boiling effectively kills bacteria and viruses.
However, boiling:
- Does not remove heavy metals
- Does not remove PFAS
- Does not remove nitrates
- May concentrate dissolved contaminants through evaporation
Boiling is a microbiological intervention, not a chemical removal method.
What Are PFAS and Why Are They Called “Forever Chemicals”?
PFAS (per- and polyfluoroalkyl substances) are synthetic compounds used in industrial and consumer products.
They are called “forever chemicals” because:
- They resist environmental breakdown
- They persist in groundwater
- They accumulate in human blood over time
Regulation is evolving, and removal typically requires reverse osmosis or specialized carbon filtration.
How Do I Know If I Have Lead Pipes?
Indicators include:
- Home built before 1986
- Dull gray pipe that scratches easily
- Magnetic test (lead is non-magnetic)
The most reliable method is professional inspection or utility records.
Testing first-draw water for lead confirms exposure risk.
Are Microplastics in Tap Water Dangerous?
Microplastics have been detected in both tap and bottled water.
Research is ongoing.
Current evidence suggests:
- Widespread exposure exists
- Long-term health effects are still being studied
- Reverse osmosis may reduce particle presence
Risk communication remains precautionary rather than definitive.
What Is Hard Water and Is It Dangerous?
Hard water contains elevated calcium and magnesium.
It is not generally harmful to health.
However, it may:
- Damage plumbing
- Reduce appliance efficiency
- Cause soap scum buildup
Water softeners address hardness but do not remove chemical contaminants.
Why Does My Water Smell Like Chlorine?
Chlorine is used to disinfect municipal water.
A mild chlorine odor indicates residual disinfectant presence.
Activated carbon filters can reduce chlorine taste and odor if desired.
How Long Do Water Filters Last?
Filter lifespan depends on:
- Water quality
- Usage volume
- Manufacturer design
Typical ranges:
- Pitcher filters: 2–3 months
- Carbon cartridges: 3–6 months
- RO membranes: 2–5 years
Failure to replace filters can reduce effectiveness.
Can Reverse Osmosis Remove Fluoride?
Yes.
Reverse osmosis systems are highly effective at removing fluoride, along with many other dissolved ions.
Activated carbon filters generally do not remove fluoride unless specifically designed to do so.
Is Fluoride in Drinking Water Safe?
Community water fluoridation is endorsed by major public health organizations at regulated levels.
However, individuals seeking to reduce fluoride exposure can use reverse osmosis filtration.
Decisions often reflect personal preference and regional policy rather than contamination events.
How Can I Reduce Risk Without Installing a Whole-House System?
Practical steps include:
- Testing your water
- Installing certified point-of-use filtration
- Replacing filters on schedule
- Flushing stagnant water
- Monitoring local water reports
Targeted, data-driven interventions are often sufficient.